
The “Mobilität in Deutschland” (MiD) survey is one of the largest studies of its kind worldwide. It uses a very high amount of data to show how mobility is actually experienced in Germany. What follows is an overview of the results.
Mobility in transition: decline in trips and velocity
Compared to the surveys conducted in 2002, 2008 and 2017, it is evident that the German population is travelling less and slower overall. The average number of trips describes how many trips a person takes on a daily basis. While it rose slightly from 3.3 trips in 2002 to 3.4 trips in 2008, it fell to 3.1 trips in 2017 and was at 2.9 trips per day in 2023. Despite the decline in the number of trips and daily kilometres travelled, the average daily travel time with 84 minutes per day remains at almost the same level as 2017 (85 minutes), when the MiD was last taken. The reasons for the lower number of trips include working from home, online shopping and the increased bundling of trips. The almost constant travel time despite the declining number of trips indicates a slower than before traffic.
Economic status1 also influences the mobility rate: while 86 per cent of people with very high incomes are mobile on a daily basis, the figure for those with very low incomes is only 74 per cent. The gap between these groups has widened slightly compared to MiD 2017 (2017: 8 per cent, 2023: 12 per cent). This points to inequalities in the ability to participate in public life or towards a different utilization of mobility.
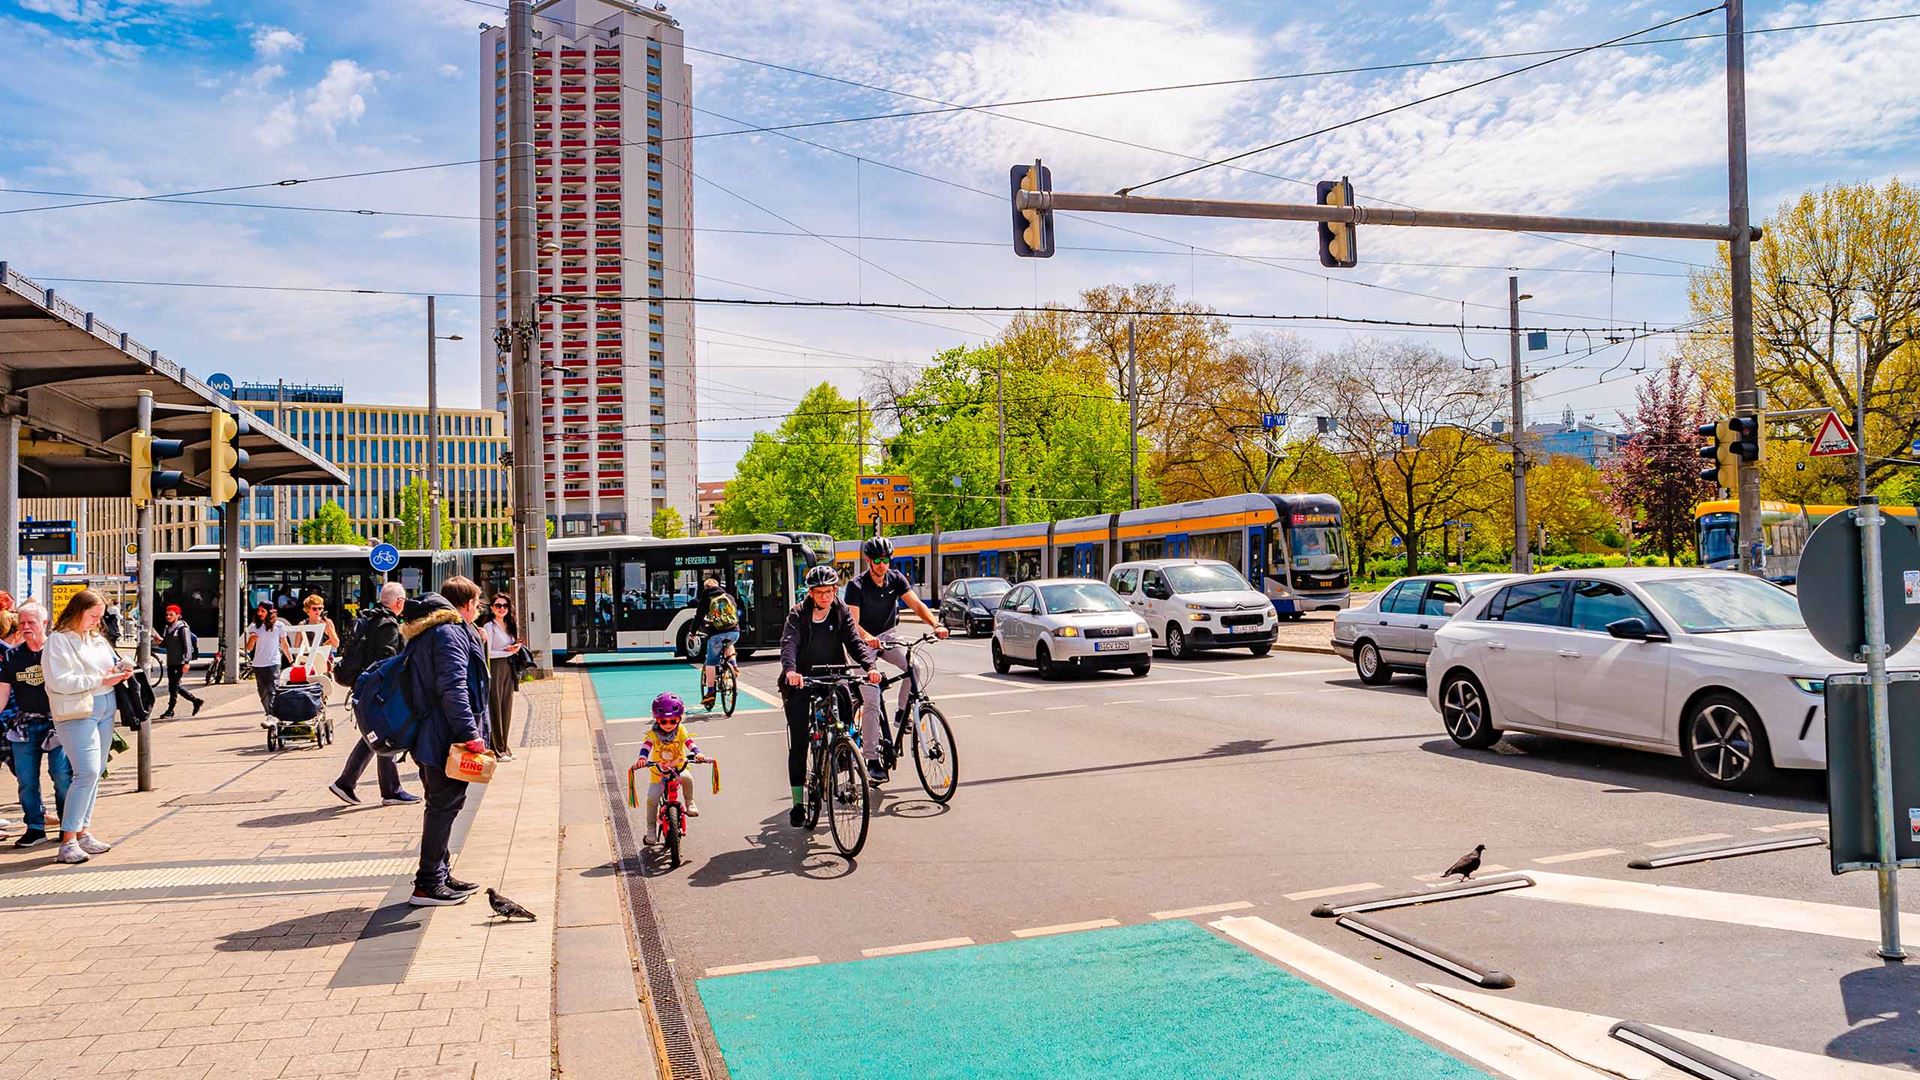
Spatial structure determines the mode of transportation
A comparison of urban and rural spaces shows that in metropolitan areas and large cities, trips taken by car and trips made on foot are almost equally distributed (33.6 per cent versus 31.2 per cent). This figure refers to the proportion of trips, not the distance travelled in kilometres. The similarities in both forms of mobility with regard to urban spaces can be explained by the high density of residential, work and supply locations in cities, which favours short distances and encourages walking. Public transport is, at 20.4 per cent, the third most frequently used mode of transportation in metropolitan areas and large cities. At 14.8 per cent, the bicycle (including e-bikes) is the least frequently used mode of transportation. A similar level is to be found in rural areas.
Cars clearly dominate in rural areas: at 63.2 per cent, they are the main means of transportation and are used more than twelve times as often as public transport. Around one-fifth of trips are made on foot.
Car sharing services play a particularly important role in metropolitan areas and large cities. More than one in five households now has at least one membership – almost twice as many as in 2017. At the same time, the proportion of members who hardly ever use car sharing has risen from 22 per cent in 2017 to 25 per cent in 2023.
Continue reading on Gateway to Automotive